Logan Schmid · 5 September 2026
Street-Level Imagery Driving Subtle Shifts in City Zoning Policies Worldwide
Cities around the globe have started integrating street-level imagery into zoning review processes because this visual data offers granular details on building conditions, land use patterns, and infrastructure that satellite images and traditional surveys often miss, and researchers have documented how such tools allow municipal officials to identify mismatches between existing zoning rules and actual development on the ground.
Expanding Data Sources for Urban Planning Teams
Street-level imagery from services like Google Street View and municipal camera networks supplies planners with up-to-date visuals of streets, sidewalks, and building facades, while analysts combine these images with geographic information systems to map changes in neighborhood character over time. In September 2026 several North American and European municipalities reported increased adoption rates after new high-resolution datasets became available through public-private partnerships. Observers note that planners in cities such as Toronto and Barcelona have used these resources to evaluate parking requirements and setback rules more precisely than before, since the imagery reveals actual vehicle density and building placements that outdated paper records fail to capture.
Data from the American Planning Association shows that over 40 percent of surveyed planning departments now reference street-level imagery during routine zoning updates, and this figure has risen steadily since 2022 as software tools for image analysis have improved. Those who have studied the trend point out that the technology reduces reliance on costly field visits yet still requires human verification to account for seasonal variations or temporary construction activity.
Case Examples from Multiple Regions
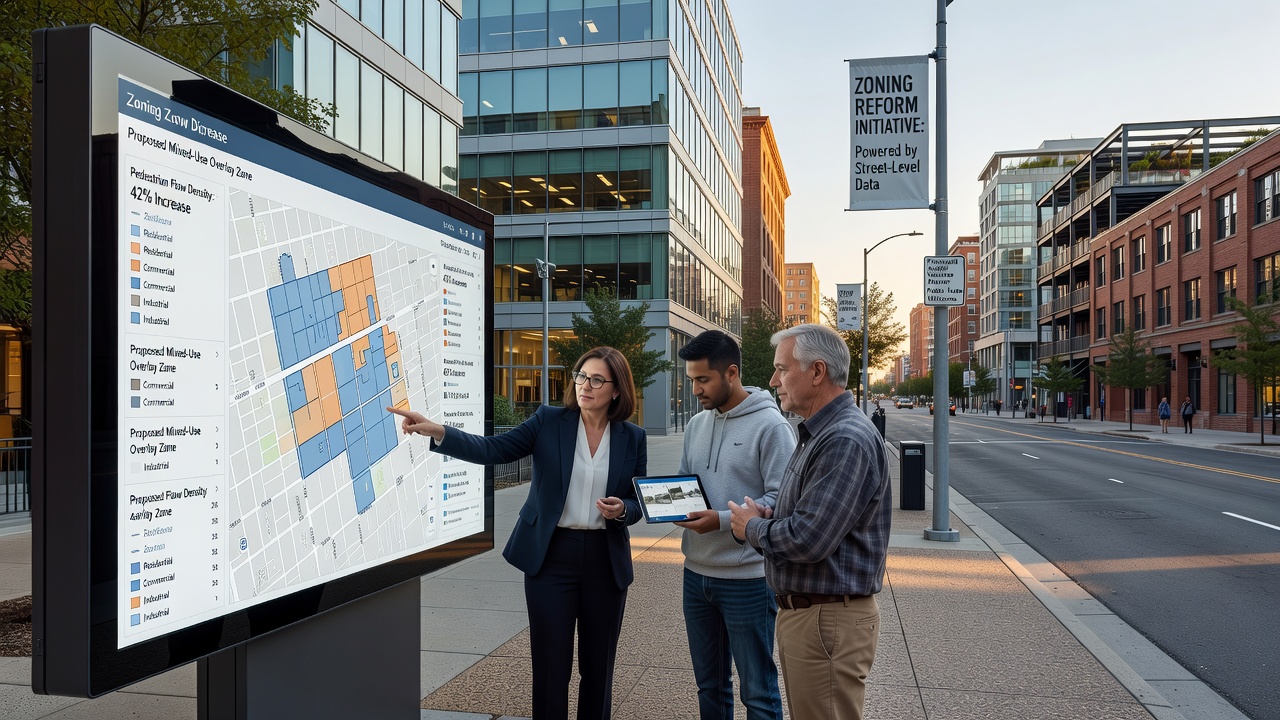
Take one planning team in Melbourne that noticed discrepancies between permitted residential densities and observed housing types through repeated imagery reviews, which prompted adjustments to allow more accessory dwelling units in single-family zones. Similar work in Vancouver revealed underutilized commercial strips where imagery documented vacant storefronts and excess surface parking, leading to proposals for mixed-use overlays that encourage ground-floor retail with upper-level housing. In each instance the visual evidence supported arguments for reform without relying solely on abstract statistical models.

European cities have followed comparable paths, with the European Commission regional policy reports documenting pilot projects in Lyon and Hamburg that used imagery to assess compliance with green space mandates. Planners there identified blocks where new developments had reduced tree cover more than permitted, prompting stricter enforcement and revised zoning language that ties approvals to visible landscaping outcomes. What's interesting is how these visual audits create feedback loops, since updated imagery captured after reforms allows officials to measure whether changes produced the intended results.
Technical Integration and Policy Feedback Loops
Software platforms now automate much of the initial image processing, flagging properties that appear to violate height limits or parking minimums, yet final decisions still rest with human reviewers who cross-reference the visuals against legal code language. Researchers at several universities have published studies showing that cities using these methods complete zoning audits faster and with fewer appeals, because property owners receive clearer documentation of existing conditions. The process works because imagery provides a shared reference point that reduces disputes over factual descriptions of sites.
Yet the approach carries limitations that planners continue to address, including privacy concerns around identifiable individuals or vehicles in the images and the need for regular updates to keep data current. Municipalities in Australia and Canada have begun requiring periodic re-imaging cycles tied to zoning review schedules, ensuring that reforms reflect recent physical changes rather than static snapshots from years earlier. Those who've studied this know that combining imagery with census data and building permit records yields the most reliable foundation for policy adjustments.
Conclusion
Street-level imagery continues to reshape how municipalities approach zoning reforms by supplying detailed, verifiable visuals that complement traditional planning datasets, and the trend shows no sign of slowing as image resolution improves and analysis tools become more accessible. Cities that have adopted these methods report more targeted policy changes, while researchers track outcomes across regions to identify best practices that others can adapt. The quiet influence stems from the simple fact that seeing current conditions at street level changes the questions planners ask and the solutions they propose.