Jonas Reed · 3 October 2026
Interactive Exhibits Drive New Patterns in Climate Data Visualization Engagement
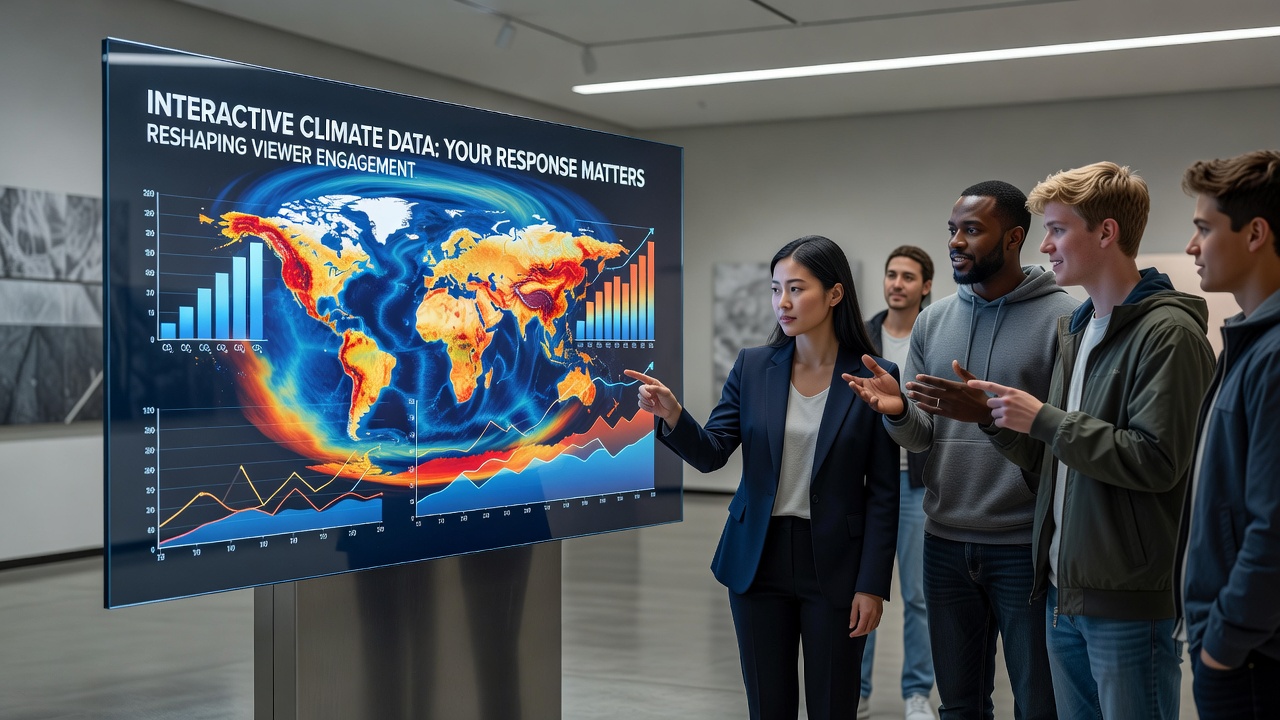
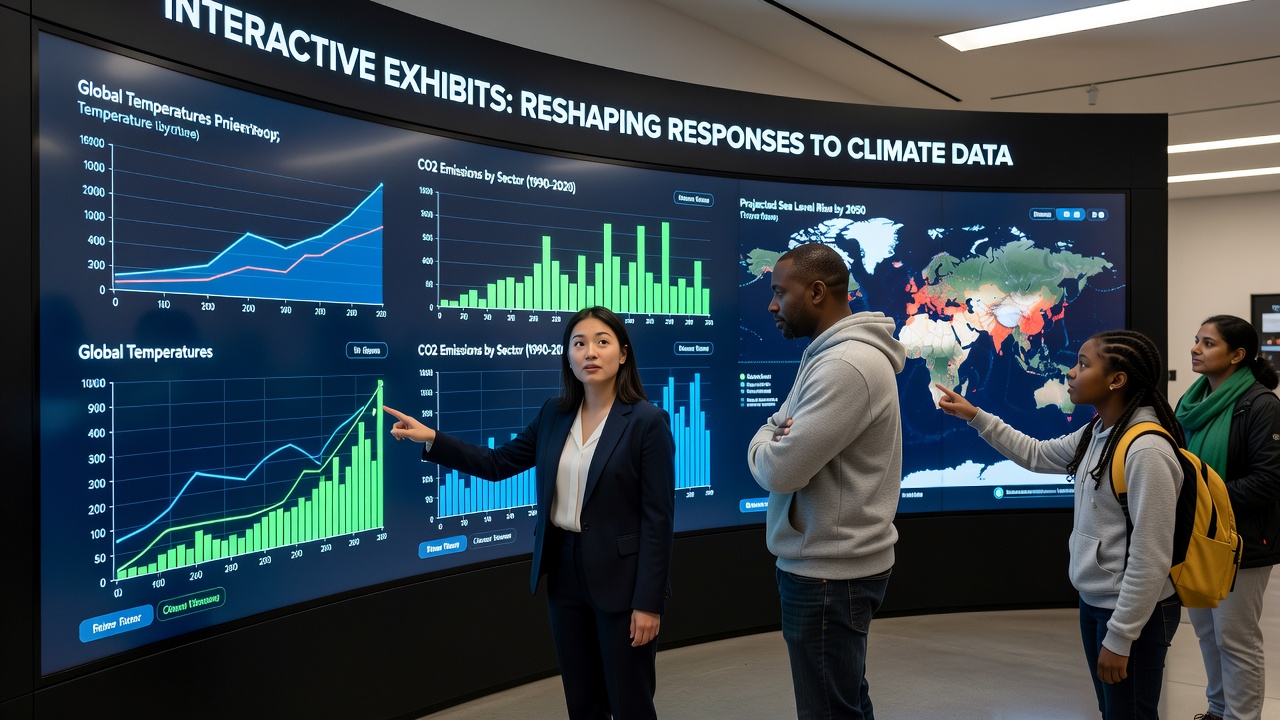
Interactive exhibits have begun altering how audiences process climate data visualizations, according to multiple research projects tracking museum and science center visitors since 2023, while traditional static charts often lead to quick glances and limited retention, touch-based displays allow users to adjust variables such as emission scenarios or regional temperature shifts and observe immediate visual feedback that connects abstract numbers to tangible outcomes.
Technical Features Behind the Shift
Modern installations combine real-time data streams from sources like satellite records with layered graphics that respond to user inputs, and developers integrate sliders for carbon dioxide levels alongside maps that highlight flood risks or drought patterns, which means visitors can toggle between historical baselines and future projections without needing prior technical knowledge. Studies from institutions in North America and Europe indicate these controls increase dwell time by factors of three to five compared with printed posters, and the same research notes higher rates of follow-up questions directed at staff after sessions with the interactive tools.
Evidence from Recent Installations
One exhibit opened at a major science center in California during early 2025 and tracked visitor behavior through heat sensors and click logs, revealing that participants who manipulated sea-level rise models spent additional minutes exploring related datasets on ocean acidification, whereas those viewing the same information on static screens moved on within thirty seconds on average. Similar patterns emerged at a European facility that launched an updated climate hall in October 2026, where integrated motion tracking showed repeated returns to the same visualization when users could rotate 3D terrain models to view different continents. Data collected by the center's analytics team indicated a measurable uptick in requests for printed summaries after these sessions, suggesting the interactive format prompts deeper information seeking once the initial engagement ends.
Researchers at universities in Australia and Canada have examined emotional responses through surveys administered immediately after exhibit use, and their findings show elevated self-reported concern when viewers control the speed of ice melt animations compared with passive observation of the same footage. The studies also record modest increases in stated willingness to discuss climate topics with family members or colleagues following the experience, though long-term behavioral tracking remains limited at this stage.
Comparative Analysis Across Regions
Installations in urban museums tend to emphasize local impacts such as city-specific heat island effects, while rural centers often focus on agricultural yield projections under varying rainfall scenarios, yet both approaches rely on the same core principle of user-driven parameter adjustment. Reports from the NASA climate data portal have supplied baseline datasets for many of these projects, allowing consistent global comparisons that visitors can localize through simple interface choices. In parallel, the European Environment Agency has contributed regional overlays that institutions in multiple member states have layered onto shared visualization engines, creating a patchwork of tailored yet interoperable experiences.
Measurement Methods and Ongoing Research
Evaluation teams employ a mix of quantitative logs and qualitative interviews to assess changes in viewer responses, and preliminary results from a 2024-2026 multi-site study indicate improved accuracy when participants later answer questions about trends such as Arctic ice decline or coral bleaching events. Eye-tracking equipment used in controlled tests reveals that interactive users scan broader areas of complex charts rather than fixating on single data points, which aligns with observations from educators who note more nuanced group discussions during post-visit debriefs. The same datasets show that younger visitors, particularly those aged 18 to 35, demonstrate the largest gains in comprehension metrics, although older cohorts also register gains when given sufficient time with the controls.
Conclusion
Interactive climate exhibits continue to expand across public venues worldwide, supported by open-access datasets and advancing display hardware, while ongoing evaluations from academic and governmental partners provide growing detail on how these tools modify information processing and subsequent engagement with climate topics. The patterns documented so far point to sustained interest in user-controlled visualizations as a method for bridging gaps between raw data and personal relevance.